The 2010 Twin Cities Real Estate Report was recently released by the Minneapolis Association of Realtors and has some fantastic data on what has been happening over the past years in the surrounding 13 county area. While this is a general overview of all real estate activity for 2010 and not a specific breakdown of the luxury home market, it provides some important insight on areas that do cater to the upper bracket real estate market.
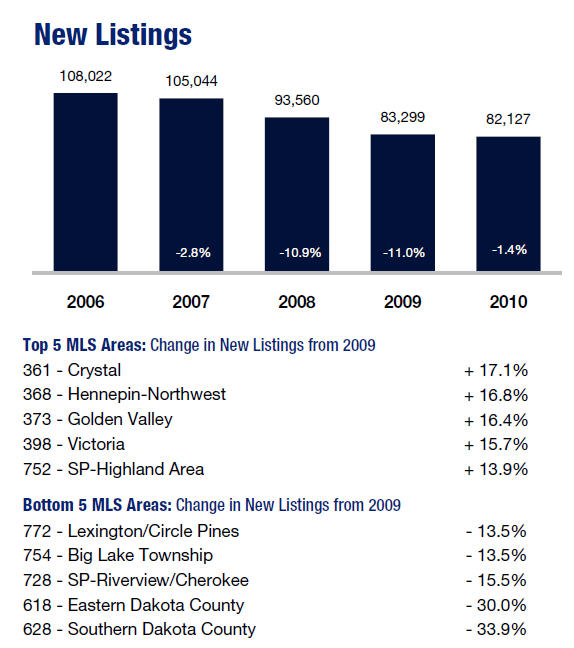
New Listings
New listings have been decreasing over the past five years, which is really no surprise to anyone. What is interesting is that 2009 and 2010 are relatively the same for homes put on the market. I like the fact the report breaks down the top/bottom five markets for new listings. For the luxury home market, Victoria is number four for most new homes listed, and has seen a 13% increase in home prices over the last year.
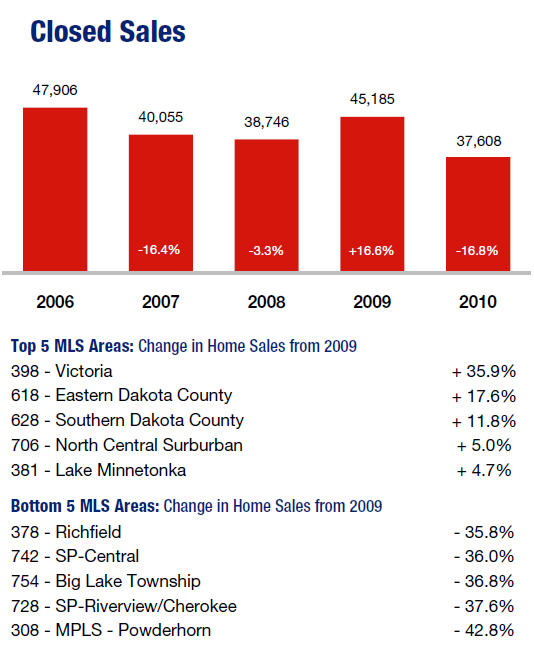
Closed Sales
For Closed Sales in 2010, the number one area for sold homes was Victoria, with Lake Minnetonka in fifth place. Victoria’s new home construction was probably a good reason for the top ranking for nearly 30% of its 2010 closed sales were due to new construction. Lake Minnetonka on the other hand saw almost 30% of its closed inventory as foreclosure or distressed properties. The desirable area coupled with lower home prices helped the Lake Minnetonka market have a better overall year than other Twin Cities areas.

Closed Sales Data 2010
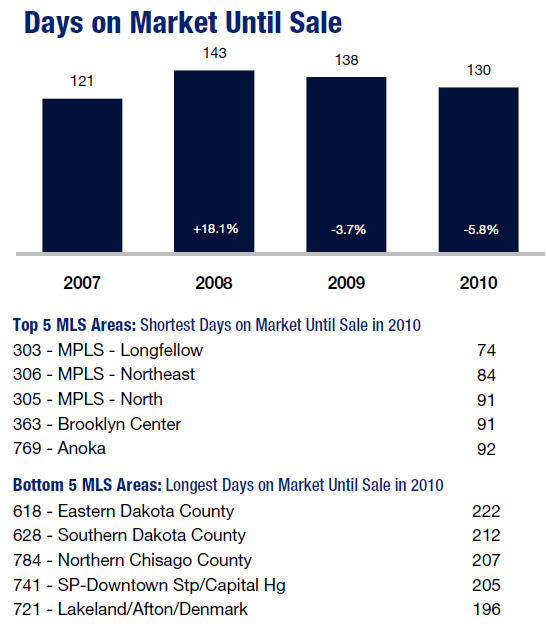
Days on the Market
One of the most important pieces of date to relay to home owners is the number of days it might take to sell their home. Known to agents as DOM, the Days on the Market helps us understand exactly what a local real estate market is doing. As you can see, when the market tanked in 2008, DOM increased dramatically. Since then, homes have been slowly seeing that time frame decline – a good thing for the overall market. Areas of Minneapolis found themselves having the shortest days to sell, most likely due to the shear volume of foreclosures in those areas. The “North” area of Minneapolis alone had 60% of its sold volume in 2010 as distressed/foreclosed properties.

2010 Days on the Market
If you would like to learn how your local real estate market performed in 2010, please feel free to send me an email!


