Posts tagged as:

market statistics

State of the Twin Cities Luxury Home Market

I thought it would be interesting to compare the current Spring real estate market for luxury homes in the Twin Cities to the last couple of years, and see if things have improved at all. The news is constantly stating that the Minnesota real estate market is roaring back to life, what with our shortage of inventory and less buyer fear, but can the same be said about the luxury market?

Days on the Market

Back in 2010, the rug was pulled out from under the luxury real estate market and it seemed to take forever for a home to sell. The average Days on the Market, what we real estate agents call DOM, was 212 – meaning that is took on average 212 days for a luxury home to sell.

Days on the Market  2010 Twin Cities Luxury Homes Days on the Market 2010

Now, look at March 2012 and the numbers get better. The average number of days drops to 170!

Day on Market Luxury Homes Twin Cities Spring 2012 
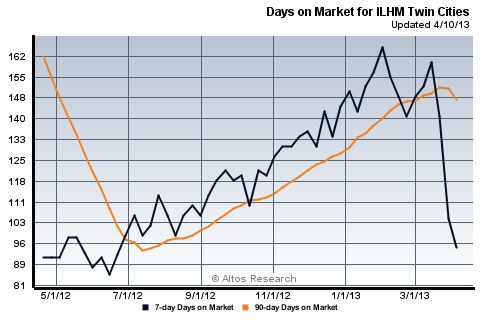
Days on the Market 2012

For April 2013, the number drops to 148!

Luxury Home Days on the Market 2013 Twin Cities Days on the Market 2013

Inventory

Inventory is often one of the deciding factors on how a real estate market will perform. Too much inventory and few buyers makes for a terrible market. In 2010, sellers were scared and wanted to get out of their expensive homes. Buyers however were very worried and became hesitant if not completely shut off from buying a new home. No other inventory in the Twin Cities felt this more than the luxury home market, starting at about 685 homes for sale in Spring 2010 and roaring to 925 in the Fall.

Minneapolis St Paul Luxury Home Market Inventory 2010 Inventory 2010

Spring 2011 started off with 653 homes on the market and increased to around 836 by September, however when Spring 2012 hit, less homes were being offered for sale – coming in at around 620.

Twin Cities Luxury Home Inventory Spring 2012 Inventory 2012

Once Fall 2012 came around, only 708  homes were for sale. That’s a 15.3% decrease from 2011!  Of course now that Spring 2013 is here, I know the market inventory is low simply by trying to find homes my clients might like. We can’t find any! That’s because there are only currently about 430 luxury homes on the market. When compared to 2010, we quickly see that the Twin Cities Spring luxury inventory has decreased by 37%!

Twin Cities Luxury Real Estate Inventory Spring2013 Inventory 2013

Average Price

Starting in late 2009, the luxury home market started to be affected by the economy, and prices started a slow decline over the next year. By August 2010, average prices began a rapid decline making 2011 a terrible year to sell an upper bracket home in the Twin Cities. Homes that once held a value well over $1 Million, were now selling for $700-800K. Foreclosures and short sales became more prevalent, as home owners found themselves underwater and unable to afford their castles.

Twin Cities Luxury Home Average Price 2010 Average Price 2010

By Spring 2012, home values were at their lowest, only bringing in an average of around $675,000, but every cloud has a silver lining. Over the last year, the average price of a luxury home has been steadily increasing, and we are now back at 2009 pricing.

Twin Cities Luxury Homes Average Price 2013

What Does It All Mean?

Wow, what a difference a few years make! While the numbers look to tell a great story, it is still a cautious time. Home owners are not listing as many homes, thus giving buyers less choices. This helps prop up the market with homes selling quicker, but buyers are still afraid of paying too much for a home. Most of the buyers I encounter refuse to pay list price, and they also want to see the price of similar homes that have sold in the area in order to justify their offers.

The most interesting information in the report, in my opinion, is not the average price number, but the graph direction in general. Looking at 2010, the graph line is going down. But take a look at what has been happening since May 2012. The graph direction is going up, as if it is trying to claw its way out of the abyss. Let’s pray it keeps going up!

0 comments

The luxury home market in the Twin Cities has taken quite a beating the last couple of years. Home values have plummeted, putting what were once million dollar homes into lower price ranges. For some home owners who bought 2005-2008, the news has been less than welcome, even devastating. Foreclosure was inevitable for a few, other have been able to refinance. But one thing I have learned from speaking to luxury home owners, they are taking it all in stride and working with the cards they have been dealt.

Currently the inventory of luxury homes has been dwindling across the Metro, good news for home sellers. Less inventory means less choices for buyers, and gives sellers a better chance of selling their home.  In Spring 2010, there were about 680 available homes for sale. Two years later, that number is down to around 615. As is typical for real estate in Minnesota, home inventory increases over the summer months, topping out in August and September. It will be interesting to see how the summer progresses and if the overall inventory remains low.

When it comes to how long a luxury home takes to sell in the Twin Cities, real estate agents turn to Days on the Market data. With Spring comes buyers. After waiting through the winter, they come out from the shadows and pluck down money for luxury homes. For reasons you can imagine here in Minnesota, it typically takes longer to sell in the winter. Starting this Spring 2012, the days it takes a luxury home to sell hovers around 170 days. While this may not sound like good news, when you compare it to Spring 2010 which hovered around 235 days, our current real estate market it doing quite well. I am pretty sure home owners would like 2012 market trends over two years ago!

If you are thinking of selling and would like a free micro analysis of your home in today’s market, please contact me!

(Data is comprised from top 10 most expensive zip codes in Minneapolis, St. Paul, Lake Minnetonka, and  surrounding Twin Cities Metro areas, using homes priced above $500,000)

0 comments

Real Estate Update for Lake Minnetonka

Today I thought it would be good to give a market update for those who live around Lake Minnetonka to show what has been happening over the last year. Below are some details and graphs to help explain the current market, with colors for graphs indicating year of data.

Median Sales Price

For the last three years, Median Sales data for Lake Minnetonka has stayed relatively the same. While 2009 saw a 12.6 % decrease from 2008, the market has rebounded slightly this past year with median sales prices increasing…good news for luxury homes around the lake. Some of the hardest hit areas in sale price over the last year have been Excelsior and Wayzata, with Spring Park having the largest increase.

Lake Minnetonka Median Sales Price for Luxury Homes
Lake Minnetonka Median Sales Price


Housing Supply and Days on the Market

The housing supply, or current inventory of homes for sale in Lake Minnetonka, is considered healthy if it is around 5-6 months. As you can see, for the last few years, expensive homes in the area have been no where near that number. Currently at 23.9 months, it will take almost a full year to sell all of the current homes on the real estate market. This number takes into account all homes surrounding lake Minnetonka so each individual town will have a different number. For instance, Excelsior has seen the largest increase in housing supply, with Greenwood and Tonka Bay coming in at a close second, but on the other end, towns like Minnetonka Beach, Wayzata, and Orono have seen a decrease in housing supply.

Number of Months to Sell Lake Minnetonka Inventory
Lake Minnetonka Housing Supply
Amount of Days on the Market Lake Minnetonka Homes Sell
Lake Minnetonka Days on the Market

With home sellers, one of the most important real estate statistics they want to know is how long it will take to sell their home. For Lake Minnetonka homes, it’s going to take awhile. Over the last year, it has taken an average of 244 days for a home to sell (Agents call this “Days on the Market” or “DOM”).  The price of homes in an area will greatly effect the DOM, so naturally the more expensive the home, the longer it will take to sell due to the fewer number of buyers able to purchase a luxury home. For Lake Minnetonka, the towns with homes taking the longest to sell are Tonka Bay, Deephaven, and Minnetrista.


 New Listings Vs. Closed Sales

The amount of New Listings that have hit the market over the last year for upper tier homes around Lake Minnetonka  have decreased 20% from the amount in 2009. So far this year, Mound and Orono hold the records for most homes to come onto the market, but for the most part, sellers are deciding to wait out the market before selling. The decrease in available homes means that buyers have less to choose from, but in the same instance, the number of homes that have sold in the last year has increased. So I guess having less homes makes it easier for buyers to make a choice, but most likely, with the percent of the original list price received by home sellers declining in many Lake Minnetonka towns, buyers are just finding homes more affordable than in 2008.

Lake Minnetonka New Home Listings March 2010 to February 2011
Lake Minnetonka New Listings

 Closed Sales over the last year for Lake Minnetonka luxury homes has increased 11% for those near or above a million dollars, with homes $500,000+ having over 22% more closed sales.

Closed Sales March 2010 to February 2011
Lake Minnetonka Closed Sales

2 comments

The 2010 Twin Cities Real Estate Report was recently released by the Minneapolis Association of Realtors and has some fantastic data on what has been happening over the past years in the surrounding 13 county area. While this is a general overview of all real estate activity for 2010 and not a specific breakdown of the luxury home market, it provides some important insight on areas that do cater to the upper bracket real estate market.

New Listings

New listings have been decreasing over the past five years, which is really no surprise to anyone. What is interesting is that 2009 and 2010 are relatively the same for homes put on the market. I like the fact the report breaks down the top/bottom five markets for new listings. For the luxury home market, Victoria is number four for most new homes listed, and has seen a 13% increase in home prices over the last year.

2010 New Listings Real Estate Market Report

New Listing Data 2010

Closed Sales

For Closed Sales in 2010, the number one area for sold homes was Victoria, with Lake Minnetonka in fifth place. Victoria’s new home construction was probably a good reason for the top ranking for nearly 30% of its 2010 closed sales were due to new construction. Lake Minnetonka on the other hand saw almost 30% of its closed inventory as foreclosure or distressed properties. The desirable area coupled with lower home prices helped the Lake Minnetonka market have a better overall year than other Twin Cities areas.

 
2010 Twin Cities Real Estate Solds

Closed Sales Data 2010

Days on the Market

 One of the most important pieces of date to relay to home owners is the number of days it might take to sell their home. Known to agents as DOM, the Days on the Market helps us understand exactly what a local real estate market is doing. As you can see, when the market tanked in 2008, DOM increased dramatically. Since then, homes have been slowly seeing that time frame decline – a good thing for the overall market. Areas of Minneapolis found themselves having the shortest days to sell, most likely due to the shear volume of foreclosures in those areas. The “North” area of Minneapolis alone had 60% of its sold volume in 2010 as distressed/foreclosed properties.

Days on the Market for Twin Cities Home Sales 2010

2010 Days on the Market

If you would like to learn how your local real estate market performed in 2010, please feel free to send me an email!

0 comments

If you would like to see a real estate “Skinny” on the general real estate market for the Twin Cities, watch the video produced by the Minneapolis Association of Realtors, with an overall view on the health of the entire market.

0 comments

With winter quickly approaching in the Twin Cities, luxury home prices remain stagnant and overall continue to fall. Popular areas such as Edina and Lake Minnetonka are holding on, but as it happens ever year around this time, buyer activity decreases with the coming cold.

Luxury Home Market Twin Cities

Twin Cities Price

Inventory for upper bracket homes across the Metro area remain high as home sellers keep properties on the market in hopes of finding that one buyer who will purchase their home. Typically luxury inventory hits rock bottom around Christmas and New Years, as sellers concentrate on other things as buyer interest declines. As spring approaches, sellers get back on the selling wagon when buyers perk up from a winter of slush. With such a vast difference in locations across town, it is obvious that a micro analysis would need to be done for each specific city to see how the luxury market fares individually.

Minneapolis St Paul Luxury Home Market Inventory

Regional Inventory for Twin Cities

  But probably the second most important statistic for home owners, behind price, is the number of days it takes for a home to sell in today’s real estate market. Known as Days on the Market (DOM), luxury homes are seeing some good news! The average amount of time a luxury home sits on the market, that being for homes priced above $500,000, is steadily declining in the Twin Cities. Currently sitting around 140 days, the contributing factorsmost likely result from a declining of the number of  homes on the market (meaning less choices for buyers) and a decrease in overall prices.

Minneapolis St Paul Days on the Market Stats

Twin Cities Days on the Market Luxury Homes


If you are interested in a free micro market analysis of your home, please contact me !

0 comments

North Oaks, located north of St. Paul, is a private community featuring many luxury homes. Like most of the luxury real estate markets in the Twin Cities, it too has taken a little of a beating this year.

According to recent statistics for 2010, closed sales for the year are up 26.9%, while listings are down almost 30%. While this might sound like welcome news, the fact of the matter is prices have suffered and thus is most likely the reason for increased home sales. Both Median and Average Sales prices are down between 12-14%. Of course, North Oaks, being a prestigious community is holding its home values better than other parts of the Twin Cities.


North Oaks MN Real Estate Market Update

Average days on the market is pretty high, currently around 234 days, but that is to be expected for expensive homes. Another important number is the Housing Supply Index which falls in around 16 months. This means that it would take approximately 16 months to sell all the current inventory in North Oaks.

If you have further questions about the real estate market in North Oaks, MN, please feel free to contact me!

0 comments

Days on the Market for Twin Cities Luxury HomesReal estate agents in the Twin Cities metro area are pretty lucky. We have Realtor associations that produce outstanding market statistics, which other cities across the nation lack. One bit of data that is extremely important to us agents, and our seller clients, is the number of days that a home is actively for sale before a buyer produces an acceptable offer – otherwise knows as DOM, “Days on the Market”.

When these numbers are compiled, they are usually presented in generalities. We might have a number that is averaged out for a certain county, city, or neighborhood, but usually the detailed numbers per zip code are over looked. All price points are usually included, so the statistics can be skewed depending on how many high-end, or low-end homes are included.  For instance, the current DOM for the Twin Cities market is 118, so an agent that comes into a luxury listing appointment using this generic stat in their CMA (Comparative Market Analysis) could be doing the seller a disservice. 

Instead, the agent should be taking into account the area the seller lives in, and presenting those statistics. As an example, in Excelsior, where homes are much more expensive, the average days on the market is around 79. Wayzata is 144. Around Long Lake, it’s up to 173. The difference is staggering for luxury homes, especially if there is a lake nearby, or if the number of homes available to purchase is less. My main point is that when dealing with upper bracket real estate, sellers should be making sure they get the most accurate and detailed market statistics available for their home. And the only way to do this is choose an agent who specializes in the luxury home market.

0 comments